The Genius Blog

Hypothesis Testing Solved Examples(Questions and Solutions)
Here is a list hypothesis testing exercises and solutions. Try to solve a question by yourself first before you look at the solution.
Question 1 In the population, the average IQ is 100 with a standard deviation of 15. A team of scientists want to test a new medication to see if it has either a positive or negative effect on intelligence, or not effect at all. A sample of 30 participants who have taken the medication has a mean of 140. Did the medication affect intelligence? View Solution to Question 1
A professor wants to know if her introductory statistics class has a good grasp of basic math. Six students are chosen at random from the class and given a math proficiency test. The professor wants the class to be able to score above 70 on the test. The six students get the following scores:62, 92, 75, 68, 83, 95. Can the professor have 90% confidence that the mean score for the class on the test would be above 70. Solution to Question 2
Question 3 In a packaging plant, a machine packs cartons with jars. It is supposed that a new machine would pack faster on the average than the machine currently used. To test the hypothesis, the time it takes each machine to pack ten cartons are recorded. The result in seconds is as follows.
| 42.1 | 42.7 |
| 41 | 43.6 |
| 41.3 | 43.8 |
| 41.8 | 43.3 |
| 42.4 | 42.5 |
| 42.8 | 43.5 |
| 43.2 | 43.1 |
| 42.3 | 41.7 |
| 41.8 | 44 |
| 42.7 | 44.1 |
Do the data provide sufficient evidence to conclude that, on the average, the new machine packs faster? Perform the required hypothesis test at the 5% level of significance. Solution to Question 3
Question 4 We want to compare the heights in inches of two groups of individuals. Here are the measurements: X: 175, 168, 168, 190, 156, 181, 182, 175, 174, 179 Y: 120, 180, 125, 188, 130, 190, 110, 185, 112, 188 Solution to Question 4
Question 5 A clinic provides a program to help their clients lose weight and asks a consumer agency to investigate the effectiveness of the program. The agency takes a sample of 15 people, weighing each person in the sample before the program begins and 3 months later. The results a tabulated below
Determine is the program is effective. Solution to Question 5
Question 6 A sample of 20 students were selected and given a diagnostic module prior to studying for a test. And then they were given the test again after completing the module. . The result of the students scores in the test before and after the test is tabulated below.
We want to see if there is significant improvement in the student’s performance due to this teaching method Solution to Question 6
Question 7 A study was performed to test wether cars get better mileage on premium gas than on regular gas. Each of 10 cars was first filled with regular or premium gas, decided by a coin toss, and the mileage for the tank was recorded. The mileage was recorded again for the same cars using other kind of gasoline. Determine wether cars get significantly better mileage with premium gas.
Mileage with regular gas: 16,20,21,22,23,22,27,25,27,28 Mileage with premium gas: 19, 22,24,24,25,25,26,26,28,32 Solution to Question 7
Question 8 An automatic cutter machine must cut steel strips of 1200 mm length. From a preliminary data, we checked that the lengths of the pieces produced by the machine can be considered as normal random variables with a 3mm standard deviation. We want to make sure that the machine is set correctly. Therefore 16 pieces of the products are randomly selected and weight. The figures were in mm: 1193,1196,1198,1195,1198,1199,1204,1193,1203,1201,1196,1200,1191,1196,1198,1191 Examine wether there is any significant deviation from the required size Solution to Question 8
Question 9 Blood pressure reading of ten patients before and after medication for reducing the blood pressure are as follows
Patient: 1,2,3,4,5,6,7,8,9,10 Before treatment: 86,84,78,90,92,77,89,90,90,86 After treatment: 80,80,92,79,92,82,88,89,92,83
Test the null hypothesis of no effect agains the alternate hypothesis that medication is effective. Execute it with Wilcoxon test Solution to Question 9
Question on ANOVA Sussan Sound predicts that students will learn most effectively with a constant background sound, as opposed to an unpredictable sound or no sound at all. She randomly divides 24 students into three groups of 8 each. All students study a passage of text for 30 minutes. Those in group 1 study with background sound at a constant volume in the background. Those in group 2 study with nose that changes volume periodically. Those in group 3 study with no sound at all. After studying, all students take a 10 point multiple choice test over the material. Their scores are tabulated below.
Group1: Constant sound: 7,4,6,8,6,6,2,9 Group 2: Random sound: 5,5,3,4,4,7,2,2 Group 3: No sound at all: 2,4,7,1,2,1,5,5 Solution to Question 10
Question 11 Using the following three groups of data, perform a one-way analysis of variance using α = 0.05.
| 51 | 23 | 56 |
| 45 | 43 | 76 |
| 33 | 23 | 74 |
| 45 | 43 | 87 |
| 67 | 45 | 56 |
Solution to Question 11
Question 12 In a packaging plant, a machine packs cartons with jars. It is supposed that a new machine would pack faster on the average than the machine currently used. To test the hypothesis, the time it takes each machine to pack ten cartons are recorded. The result in seconds is as follows.
New Machine: 42,41,41.3,41.8,42.4,42.8,43.2,42.3,41.8,42.7 Old Machine: 42.7,43.6,43.8,43.3,42.5,43.5,43.1,41.7,44,44.1
Perform an F-test to determine if the null hypothesis should be accepted. Solution to Question 12
Question 13 A random sample 500 U.S adults are questioned about their political affiliation and opinion on a tax reform bill. We need to test if the political affiliation and their opinon on a tax reform bill are dependent, at 5% level of significance. The observed contingency table is given below.
| total | ||||
| 138 | 83 | 64 | 285 | |
| 64 | 67 | 84 | 215 | |
| total | 202 | 150 | 148 | 500 |
Solution to Question 13
Question 14 Can a dice be considered regular which is showing the following frequency distribution during 1000 throws?
| 1 | 2 | 3 | 4 | 5 | 6 | |
| 182 | 154 | 162 | 175 | 151 | 176 |
Solution to Question 14
Solution to Question 15
Question 16 A newly developed muesli contains five types of seeds (A, B, C, D and E). The percentage of which is 35%, 25%, 20%, 10% and 10% according to the product information. In a randomly selected muesli, the following volume distribution was found.
| Component | A | B | C | D | E |
| Number of Pieces | 184 | 145 | 100 | 63 | 63 |
Lets us decide about the null hypothesis whether the composition of the sample corresponds to the distribution indicated on the packaging at alpha = 0.1 significance level. Solution to Question 16
Question 17 A research team investigated whether there was any significant correlation between the severity of a certain disease runoff and the age of the patients. During the study, data for n = 200 patients were collected and grouped according to the severity of the disease and the age of the patient. The table below shows the result
| 41 | 34 | 9 | ||
| 25 | 25 | 12 | ||
| 6 | 33 | 15 | ||
Let us decided about the correlation between the age of the patients and the severity of disease progression. Solution to Question 17
Question 18 A publisher is interested in determine which of three book cover is most attractive. He interviews 400 people in each of the three states (California, Illinois and New York), and asks each person which of the cover he or she prefers. The number of preference for each cover is as follows:
| 81 | 60 | 182 | 323 | |
| 78 | 93 | 95 | 266 | |
| 241 | 247 | 123 | 611 | |
| 400 | 400 | 400 | 1200 |
Do these data indicate that there are regional differences in people’s preferences concerning these covers? Use the 0.05 level of significance. Solution to Question 18
Question 19 Trees planted along the road were checked for which ones are healthy(H) or diseased (D) and the following arrangement of the trees were obtained:
H H H H D D D H H H H H H H D D H H D D D
Test at the = 0.05 significance wether this arrangement may be regarded as random
Solution to Question 19
Question 20 Suppose we flip a coin n = 15 times and come up with the following arrangements
H T T T H H T T T T H H T H H
(H = head, T = tail)
Test at the alpha = 0.05 significance level whether this arrangement may be regarded as random.
Solution to Question 20
kindsonthegenius
You might also like, hypothesis testing question 21 – wald-wolfowitz run test for large sample (step by step procedure), welch’s t-test – how and when to use it, hypothesis testing problems – question 8(an automatic cutter machine…).
I am really impressed with your writing abilities as well as with the structure to your weblog. Is this a paid subject matter or did you modify it yourself?
Either way stay up the excellent high quality writing, it’s uncommon to look a great blog like this one these days..
Below are given the gain in weights (in lbs.) of pigs fed on two diet A and B Dieta 25 32 30 34 24 14 32 24 30 31 35 25 – – DietB 44 34 22 10 47 31 40 30 32 35 18 21 35 29
9.4 Full Hypothesis Test Examples
Tests on means, example 9.8.
Jeffrey, as an eight-year old, established a mean time of 16.43 seconds for swimming the 25-yard freestyle, with a standard deviation of 0.8 seconds . His dad, Frank, thought that Jeffrey could swim the 25-yard freestyle faster using goggles. Frank bought Jeffrey a new pair of expensive goggles and timed Jeffrey for 15 25-yard freestyle swims . For the 15 swims, Jeffrey's mean time was 16 seconds. Frank thought that the goggles helped Jeffrey to swim faster than the 16.43 seconds. Conduct a hypothesis test using a preset α = 0.05.
Set up the Hypothesis Test:
Since the problem is about a mean, this is a test of a single population mean .
Set the null and alternative hypothesis:
In this case there is an implied challenge or claim. This is that the goggles will reduce the swimming time. The effect of this is to set the hypothesis as a one-tailed test. The claim will always be in the alternative hypothesis because the burden of proof always lies with the alternative. Remember that the status quo must be defeated with a high degree of confidence, in this case 95 % confidence. The null and alternative hypotheses are thus:
H 0 : μ ≥ 16.43 H a : μ < 16.43
For Jeffrey to swim faster, his time will be less than 16.43 seconds. The "<" tells you this is left-tailed.
Determine the distribution needed:
Random variable: X ¯ X ¯ = the mean time to swim the 25-yard freestyle.
Distribution for the test statistic:
The sample size is less than 30 and we do not know the population standard deviation so this is a t-test. and the proper formula is: t c = X ¯ - μ 0 σ / n t c = X ¯ - μ 0 σ / n
μ 0 = 16.43 comes from H 0 and not the data. X ¯ X ¯ = 16. s = 0.8, and n = 15.
Our step 2, setting the level of significance, has already been determined by the problem, .05 for a 95 % significance level. It is worth thinking about the meaning of this choice. The Type I error is to conclude that Jeffrey swims the 25-yard freestyle, on average, in less than 16.43 seconds when, in fact, he actually swims the 25-yard freestyle, on average, in 16.43 seconds. (Reject the null hypothesis when the null hypothesis is true.) For this case the only concern with a Type I error would seem to be that Jeffery’s dad may fail to bet on his son’s victory because he does not have appropriate confidence in the effect of the goggles.
To find the critical value we need to select the appropriate test statistic. We have concluded that this is a t-test on the basis of the sample size and that we are interested in a population mean. We can now draw the graph of the t-distribution and mark the critical value. For this problem the degrees of freedom are n-1, or 14. Looking up 14 degrees of freedom at the 0.05 column of the t-table we find 1.761. This is the critical value and we can put this on our graph.
Step 3 is the calculation of the test statistic using the formula we have selected. We find that the calculated test statistic is 2.08, meaning that the sample mean is 2.08 standard deviations away from the hypothesized mean of 16.43.
Step 4 has us compare the test statistic and the critical value and mark these on the graph. We see that the test statistic is in the tail and thus we move to step 4 and reach a conclusion. The probability that an average time of 16 minutes could come from a distribution with a population mean of 16.43 minutes is too unlikely for us to accept the null hypothesis. We cannot accept the null.
Step 5 has us state our conclusions first formally and then less formally. A formal conclusion would be stated as: “With a 95% level of significance we cannot accept the null hypothesis that the swimming time with goggles comes from a distribution with a population mean time of 16.43 minutes.” Less formally, “With 95% significance we believe that the goggles improves swimming speed”
If we wished to use the p-value system of reaching a conclusion we would calculate the statistic and take the additional step to find the probability of being 2.08 standard deviations from the mean on a t-distribution. This value is .0187. Comparing this to the α-level of .05 we see that we cannot accept the null. The p-value has been put on the graph as the shaded area beyond -2.08 and it shows that it is smaller than the hatched area which is the alpha level of 0.05. Both methods reach the same conclusion that we cannot accept the null hypothesis.
The mean throwing distance of a football for Marco, a high school freshman quarterback, is 40 yards, with a standard deviation of two yards. The team coach tells Marco to adjust his grip to get more distance. The coach records the distances for 20 throws. For the 20 throws, Marco’s mean distance was 45 yards. The coach thought the different grip helped Marco throw farther than 40 yards. Conduct a hypothesis test using a preset α = 0.05. Assume the throw distances for footballs are normal.
First, determine what type of test this is, set up the hypothesis test, find the p -value, sketch the graph, and state your conclusion.
Example 9.9
Jane has just begun her new job as on the sales force of a very competitive company. In a sample of 16 sales calls it was found that she closed the contract for an average value of 108 dollars with a standard deviation of 12 dollars. Test at 5% significance that the population mean is at least 100 dollars against the alternative that it is less than 100 dollars. Company policy requires that new members of the sales force must exceed an average of $100 per contract during the trial employment period. Can we conclude that Jane has met this requirement at the significance level of 95%?
- H 0 : µ ≤ 100 H a : µ > 100 The null and alternative hypothesis are for the parameter µ because the number of dollars of the contracts is a continuous random variable. Also, this is a one-tailed test because the company has only an interested if the number of dollars per contact is below a particular number not "too high" a number. This can be thought of as making a claim that the requirement is being met and thus the claim is in the alternative hypothesis.
- Test statistic: t c = x ¯ − µ 0 s n = 108 − 100 ( 12 16 ) = 2.67 t c = x ¯ − µ 0 s n = 108 − 100 ( 12 16 ) = 2.67
- Critical value: t a = 1.753 t a = 1.753 with n-1 degrees of freedom= 15
The test statistic is a Student's t because the sample size is below 30; therefore, we cannot use the normal distribution. Comparing the calculated value of the test statistic and the critical value of t t ( t a ) ( t a ) at a 5% significance level, we see that the calculated value is in the tail of the distribution. Thus, we conclude that 108 dollars per contract is significantly larger than the hypothesized value of 100 and thus we cannot accept the null hypothesis. There is evidence that supports Jane's performance meets company standards.
It is believed that a stock price for a particular company will grow at a rate of $5 per week with a standard deviation of $1. An investor believes the stock won’t grow as quickly. The changes in stock price is recorded for ten weeks and are as follows: $4, $3, $2, $3, $1, $7, $2, $1, $1, $2. Perform a hypothesis test using a 5% level of significance. State the null and alternative hypotheses, state your conclusion, and identify the Type I errors.
Example 9.10
A manufacturer of salad dressings uses machines to dispense liquid ingredients into bottles that move along a filling line. The machine that dispenses salad dressings is working properly when 8 ounces are dispensed. Suppose that the average amount dispensed in a particular sample of 35 bottles is 7.91 ounces with a variance of 0.03 ounces squared, s 2 s 2 . Is there evidence that the machine should be stopped and production wait for repairs? The lost production from a shutdown is potentially so great that management feels that the level of significance in the analysis should be 99%.
Again we will follow the steps in our analysis of this problem.
STEP 1 : Set the Null and Alternative Hypothesis. The random variable is the quantity of fluid placed in the bottles. This is a continuous random variable and the parameter we are interested in is the mean. Our hypothesis therefore is about the mean. In this case we are concerned that the machine is not filling properly. From what we are told it does not matter if the machine is over-filling or under-filling, both seem to be an equally bad error. This tells us that this is a two-tailed test: if the machine is malfunctioning it will be shutdown regardless if it is from over-filling or under-filling. The null and alternative hypotheses are thus:
STEP 2 : Decide the level of significance and draw the graph showing the critical value.
This problem has already set the level of significance at 99%. The decision seems an appropriate one and shows the thought process when setting the significance level. Management wants to be very certain, as certain as probability will allow, that they are not shutting down a machine that is not in need of repair. To draw the distribution and the critical value, we need to know which distribution to use. Because this is a continuous random variable and we are interested in the mean, and the sample size is greater than 30, the appropriate distribution is the normal distribution and the relevant critical value is 2.575 from the normal table or the t-table at 0.005 column and infinite degrees of freedom. We draw the graph and mark these points.
STEP 3 : Calculate sample parameters and the test statistic. The sample parameters are provided, the sample mean is 7.91 and the sample variance is .03 and the sample size is 35. We need to note that the sample variance was provided not the sample standard deviation, which is what we need for the formula. Remembering that the standard deviation is simply the square root of the variance, we therefore know the sample standard deviation, s, is 0.173. With this information we calculate the test statistic as -3.07, and mark it on the graph.
STEP 4 : Compare test statistic and the critical values Now we compare the test statistic and the critical value by placing the test statistic on the graph. We see that the test statistic is in the tail, decidedly greater than the critical value of 2.575. We note that even the very small difference between the hypothesized value and the sample value is still a large number of standard deviations. The sample mean is only 0.08 ounces different from the required level of 8 ounces, but it is 3 plus standard deviations away and thus we cannot accept the null hypothesis.
STEP 5 : Reach a Conclusion
Three standard deviations of a test statistic will guarantee that the test will fail. The probability that anything is within three standard deviations is almost zero. Actually it is 0.0026 on the normal distribution, which is certainly almost zero in a practical sense. Our formal conclusion would be “ At a 99% level of significance we cannot accept the hypothesis that the sample mean came from a distribution with a mean of 8 ounces” Or less formally, and getting to the point, “At a 99% level of significance we conclude that the machine is under filling the bottles and is in need of repair”.
Hypothesis Test for Proportions
Just as there were confidence intervals for proportions, or more formally, the population parameter p of the binomial distribution, there is the ability to test hypotheses concerning p .
The population parameter for the binomial is p . The estimated value (point estimate) for p is p′ where p′ = x/n , x is the number of successes in the sample and n is the sample size.
When you perform a hypothesis test of a population proportion p , you take a simple random sample from the population. The conditions for a binomial distribution must be met, which are: there are a certain number n of independent trials meaning random sampling, the outcomes of any trial are binary, success or failure, and each trial has the same probability of a success p . The shape of the binomial distribution needs to be similar to the shape of the normal distribution. To ensure this, the quantities np′ and nq′ must both be greater than five ( np′ > 5 and nq′ > 5). In this case the binomial distribution of a sample (estimated) proportion can be approximated by the normal distribution with μ = np μ = np and σ = npq σ = npq . Remember that q = 1 – p q = 1 – p . There is no distribution that can correct for this small sample bias and thus if these conditions are not met we simply cannot test the hypothesis with the data available at that time. We met this condition when we first were estimating confidence intervals for p .
Again, we begin with the standardizing formula modified because this is the distribution of a binomial.
Substituting p 0 p 0 , the hypothesized value of p , we have:
This is the test statistic for testing hypothesized values of p , where the null and alternative hypotheses take one of the following forms:
| Two-tailed test | One-tailed test | One-tailed test |
|---|---|---|
| H : p = p | H : p ≤ p | H : p ≥ p |
| H : p ≠ p | H : p > p | H : p < p |
The decision rule stated above applies here also: if the calculated value of Z c shows that the sample proportion is "too many" standard deviations from the hypothesized proportion, the null hypothesis cannot be accepted. The decision as to what is "too many" is pre-determined by the analyst depending on the level of significance required in the test.
Example 9.11
The mortgage department of a large bank is interested in the nature of loans of first-time borrowers. This information will be used to tailor their marketing strategy. They believe that 50% of first-time borrowers take out smaller loans than other borrowers. They perform a hypothesis test to determine if the percentage is the same or different from 50% . They sample 100 first-time borrowers and find 53 of these loans are smaller that the other borrowers. For the hypothesis test, they choose a 5% level of significance.
STEP 1 : Set the null and alternative hypothesis.
H 0 : p = 0.50 H a : p ≠ 0.50
The words "is the same or different from" tell you this is a two-tailed test. The Type I and Type II errors are as follows: The Type I error is to conclude that the proportion of borrowers is different from 50% when, in fact, the proportion is actually 50%. (Reject the null hypothesis when the null hypothesis is true). The Type II error is there is not enough evidence to conclude that the proportion of first time borrowers differs from 50% when, in fact, the proportion does differ from 50%. (You fail to reject the null hypothesis when the null hypothesis is false.)
STEP 2 : Decide the level of significance and draw the graph showing the critical value
The level of significance has been set by the problem at the 95% level. Because this is two-tailed test one-half of the alpha value will be in the upper tail and one-half in the lower tail as shown on the graph. The critical value for the normal distribution at the 95% level of confidence is 1.96. This can easily be found on the student’s t-table at the very bottom at infinite degrees of freedom remembering that at infinity the t-distribution is the normal distribution. Of course the value can also be found on the normal table but you have go looking for one-half of 95 (0.475) inside the body of the table and then read out to the sides and top for the number of standard deviations.
STEP 3 : Calculate the sample parameters and critical value of the test statistic.
The test statistic is a normal distribution, Z, for testing proportions and is:
For this case, the sample of 100 found 53 first-time borrowers were different from other borrowers. The sample proportion, p′ = 53/100= 0.53 The test question, therefore, is : “Is 0.53 significantly different from .50?” Putting these values into the formula for the test statistic we find that 0.53 is only 0.60 standard deviations away from .50. This is barely off of the mean of the standard normal distribution of zero. There is virtually no difference from the sample proportion and the hypothesized proportion in terms of standard deviations.
STEP 4 : Compare the test statistic and the critical value.
The calculated value is well within the critical values of ± 1.96 standard deviations and thus we cannot reject the null hypothesis. To reject the null hypothesis we need significant evident of difference between the hypothesized value and the sample value. In this case the sample value is very nearly the same as the hypothesized value measured in terms of standard deviations.
STEP 5 : Reach a conclusion
The formal conclusion would be “At a 95% level of significance we cannot reject the null hypothesis that 50% of first-time borrowers have the same size loans as other borrowers”. Less formally we would say that “There is no evidence that one-half of first-time borrowers are significantly different in loan size from other borrowers”. Notice the length to which the conclusion goes to include all of the conditions that are attached to the conclusion. Statisticians for all the criticism they receive, are careful to be very specific even when this seems trivial. Statisticians cannot say more than they know and the data constrain the conclusion to be within the metes and bounds of the data.
Try It 9.11
A teacher believes that 85% of students in the class will want to go on a field trip to the local zoo. She performs a hypothesis test to determine if the percentage is the same or different from 85%. The teacher samples 50 students and 39 reply that they would want to go to the zoo. For the hypothesis test, use a 1% level of significance.
Example 9.12
Suppose a consumer group suspects that the proportion of households that have three or more cell phones is 30%. A cell phone company has reason to believe that the proportion is not 30%. Before they start a big advertising campaign, they conduct a hypothesis test. Their marketing people survey 150 households with the result that 43 of the households have three or more cell phones.
Here is an abbreviate version of the system to solve hypothesis tests applied to a test on a proportions.
Example 9.13
The National Institute of Standards and Technology provides exact data on conductivity properties of materials. Following are conductivity measurements for 11 randomly selected pieces of a particular type of glass.
1.11; 1.07; 1.11; 1.07; 1.12; 1.08; .98; .98 1.02; .95; .95 Is there convincing evidence that the average conductivity of this type of glass is greater than one? Use a significance level of 0.05.
Let’s follow a four-step process to answer this statistical question.
- H 0 : μ ≤ 1
- H a : μ > 1
- Plan : We are testing a sample mean without a known population standard deviation with less than 30 observations. Therefore, we need to use a Student's-t distribution. Assume the underlying population is normal.
- Do the calculations and draw the graph .
- State the Conclusions : We cannot accept the null hypothesis. It is reasonable to state that the data supports the claim that the average conductivity level is greater than one.
Example 9.14
In a study of 420,019 cell phone users, 172 of the subjects developed brain cancer. Test the claim that cell phone users developed brain cancer at a greater rate than that for non-cell phone users (the rate of brain cancer for non-cell phone users is 0.0340%). Since this is a critical issue, use a 0.005 significance level. Explain why the significance level should be so low in terms of a Type I error.
- H 0 : p ≤ 0.00034
- H a : p > 0.00034
If we commit a Type I error, we are essentially accepting a false claim. Since the claim describes cancer-causing environments, we want to minimize the chances of incorrectly identifying causes of cancer.
- We will be testing a sample proportion with x = 172 and n = 420,019. The sample is sufficiently large because we have np' = 420,019(0.00034) = 142.8, nq' = 420,019(0.99966) = 419,876.2, two independent outcomes, and a fixed probability of success p' = 0.00034. Thus we will be able to generalize our results to the population.
This book may not be used in the training of large language models or otherwise be ingested into large language models or generative AI offerings without OpenStax's permission.
Want to cite, share, or modify this book? This book uses the Creative Commons Attribution License and you must attribute OpenStax.
Access for free at https://openstax.org/books/introductory-business-statistics/pages/1-introduction
- Authors: Alexander Holmes, Barbara Illowsky, Susan Dean
- Publisher/website: OpenStax
- Book title: Introductory Business Statistics
- Publication date: Nov 29, 2017
- Location: Houston, Texas
- Book URL: https://openstax.org/books/introductory-business-statistics/pages/1-introduction
- Section URL: https://openstax.org/books/introductory-business-statistics/pages/9-4-full-hypothesis-test-examples
© Jun 23, 2022 OpenStax. Textbook content produced by OpenStax is licensed under a Creative Commons Attribution License . The OpenStax name, OpenStax logo, OpenStax book covers, OpenStax CNX name, and OpenStax CNX logo are not subject to the Creative Commons license and may not be reproduced without the prior and express written consent of Rice University.
Data Science Duniya
Learn Data Science, Machine Learning and Artificial Intelligence
Practice Problems on Hypothesis Testing
In this post I have put together the practice problems (from my academics study notes) to explain how in practical Hypothesis Testing works. This post is written mostly for the learners who want to deep dive into the statistics for data science. Focus will be on problem solving. For concepts please refer my previous posts on testing of hypothesis.
Prerequisite to understand Hypothesis testing examples:
- Understanding of hypothesis testing concepts
- How to use z-table, t-table and chi square table.
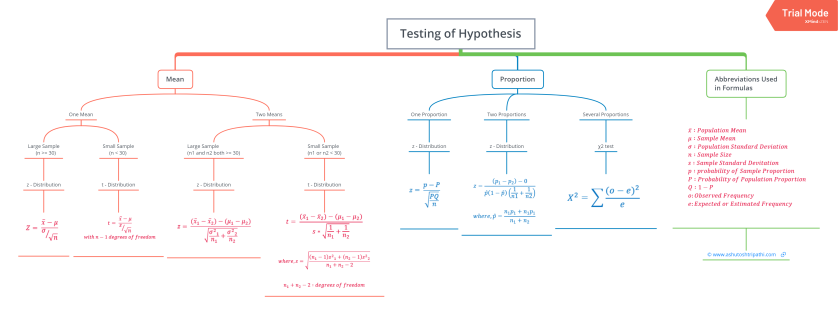
Formula list:
Critical Regions
In hypothesis testing, critical region is represented by set of values, where null hypothesis is rejected. So it is also know as region of rejection. It takes different boundary values for different level of significance. Below info graphics shows the region of rejection that is critical region and region of acceptance with respect to the level of significance 1%.

| LoS -> | α = 1% | α = 5% | α = 10% |
|---|---|---|---|
| Two Tailed Test | (-2.58, +2.58) | (-1.96, +1.96) | (-0.645, +0.645) |
| Right Tailed Test | +2.33 | +1.645 | +1.28 |
| Left Tailed Test | -2.33 | -1.645 | -1.28 |
A Telecom service provider claims that individual customers pay on an average 400 rs. per month with standard deviation of 25 rs. A random sample of 50 customers bills during a given month is taken with a mean of 250 and standard deviation of 15. What to say with respect to the claim made by the service provider?

From the data available, it is observed that 400 out of 850 customers purchased the groceries online. Can we say that most of the customers are moving towards online shopping even for groceries?

It is found that 250 errors in the randomly selected 1000 lines of code from Team A and 300 errors in 800 lines of code from Team B. Can we assume that team B’s performance is superior to that of A.

Following is the record of number of accidents took place during the various days of the week.
| Monday | Tuesday | Wednesday | Thursday | Friday | Saturday | Sunday |
|---|---|---|---|---|---|---|
| 120 | 140 | 200 | 90 | 140 | 120 | 180 |
Can we conclude that accident s are independent of the day of week?
| Observed (o) | Expected (e = average of Observed values) | χ2 = [(o-e) ]/e |
|---|---|---|
| 120 | 110 | 0.909 |
| 140 | 110 | 8.181 |
| 200 | 110 | 73.636 |
| 90 | 110 | 3.636 |
| 140 | 110 | 8.181 |
| 120 | 110 | 0.909 |
| 180 | 110 | 44.545 |

Analyze the below data and tell whether you can conclude that smoking causes cancer or not?
| Category | Diagnosed as Cancer | Without Cancer | Total |
|---|---|---|---|
| Smokers | 400 | 300 | 700 |
| Non-Smokers | 300 | 500 | 800 |
| Total | 700 | 800 | 1500 |
| Category | Diagnosed as Cancer | Without Cancer | Total |
|---|---|---|---|
| Smokers | o = 400, e = 700*700/1500 = 326 | o = 300, e = 700*800/1500 = 373 | 700 |
| Non-Smokers | o = 300, e = 800*700/1500 = 373 | o = 500, e = 800*800/1500 = 426 | 800 |
| Total | 700 | 800 | 1500 |

It is claimed that the mean of the population is 67 at 5% level of significance. Mean obtained from a random sample of size 100 is 64 with SD 3. Validate the claim.

There is an assumption that there is no significant difference between boys and girls with respect to intelligence. Tests are conducted on two groups and the following are the observations
| Mean | Standard Deviation | Size | |
|---|---|---|---|
| Girls | 75 | 8 | 60 |
| Boys | 73 | 10 | 100 |
Validate the claim with 5% LoS (Level of Significance)

An automobile tyre manufacturer claims that the average life of a particular grade of tyre is more than 20,000 km. A random sample of 16 tyres is having mean 22,000 km with a standard deviation of 5000 km.
Validate the claim of the manufacturer at 5% LoS.

That is all for now. Please share your thoughts using the comment section below.
Type your email…
Share this:
- Click to share on Twitter (Opens in new window)
- Click to share on Facebook (Opens in new window)
- Click to print (Opens in new window)
- Click to email a link to a friend (Opens in new window)
- Click to share on LinkedIn (Opens in new window)
- Click to share on Reddit (Opens in new window)
- Click to share on WhatsApp (Opens in new window)
- Click to share on Tumblr (Opens in new window)
- Click to share on Pinterest (Opens in new window)
- Click to share on Pocket (Opens in new window)
- Click to share on Telegram (Opens in new window)
I think smoking problem is wrongly concluded. There the H0 is assumed of dependency(smoking and cancer are dependent) while for chi square test, the null hypothesis is always for independence. So the H0 should be “Smoking and Cancer are independent”.
Please how can I download this page?
In the last sum the alternate hypothesis is less than 22,000 and the null hypothesis is more than 20,000. If the value turns out to be 21,000 then which hypothesis will you accept? I guess there’s an error, the alternate hypothesis should be less than equal to 20,000 and not 22,000. Correct me if I’m wrong.
Thanks for presenting above test cases, it really really helps to understand the tail concept. I am reading z-test and refer your hypothesis page as an example. I go through z-test example and in example no.8 last one it is “One tail – Left tailed test” but in the diag below it shows the right tailed. Not sure am I interpret wrong or diag error ? pls . correct me. Thanks.
The alternate hypothesis is the opposite of null hypothesis so it’s less less than or left tailed. Since the null hypothesis was accepted the graph is Right Tailed had the null hypothesis been rejected or the alternate hypothesis been accepted the graph would have been left tailed. I hope I cleared your doubt
Leave a Reply Cancel reply
This site uses Akismet to reduce spam. Learn how your comment data is processed .

- Already have a WordPress.com account? Log in now.
- Subscribe Subscribed
- Copy shortlink
- Report this content
- View post in Reader
- Manage subscriptions
- Collapse this bar
- Skip to secondary menu
- Skip to main content
- Skip to primary sidebar
Statistics By Jim
Making statistics intuitive
Hypothesis Testing: Uses, Steps & Example
By Jim Frost 4 Comments
What is Hypothesis Testing?
Hypothesis testing in statistics uses sample data to infer the properties of a whole population . These tests determine whether a random sample provides sufficient evidence to conclude an effect or relationship exists in the population. Researchers use them to help separate genuine population-level effects from false effects that random chance can create in samples. These methods are also known as significance testing.

For example, researchers are testing a new medication to see if it lowers blood pressure. They compare a group taking the drug to a control group taking a placebo. If their hypothesis test results are statistically significant, the medication’s effect of lowering blood pressure likely exists in the broader population, not just the sample studied.
Using Hypothesis Tests
A hypothesis test evaluates two mutually exclusive statements about a population to determine which statement the sample data best supports. These two statements are called the null hypothesis and the alternative hypothesis . The following are typical examples:
- Null Hypothesis : The effect does not exist in the population.
- Alternative Hypothesis : The effect does exist in the population.
Hypothesis testing accounts for the inherent uncertainty of using a sample to draw conclusions about a population, which reduces the chances of false discoveries. These procedures determine whether the sample data are sufficiently inconsistent with the null hypothesis that you can reject it. If you can reject the null, your data favor the alternative statement that an effect exists in the population.
Statistical significance in hypothesis testing indicates that an effect you see in sample data also likely exists in the population after accounting for random sampling error , variability, and sample size. Your results are statistically significant when the p-value is less than your significance level or, equivalently, when your confidence interval excludes the null hypothesis value.
Conversely, non-significant results indicate that despite an apparent sample effect, you can’t be sure it exists in the population. It could be chance variation in the sample and not a genuine effect.
Learn more about Failing to Reject the Null .
5 Steps of Significance Testing
Hypothesis testing involves five key steps, each critical to validating a research hypothesis using statistical methods:
- Formulate the Hypotheses : Write your research hypotheses as a null hypothesis (H 0 ) and an alternative hypothesis (H A ).
- Data Collection : Gather data specifically aimed at testing the hypothesis.
- Conduct A Test : Use a suitable statistical test to analyze your data.
- Make a Decision : Based on the statistical test results, decide whether to reject the null hypothesis or fail to reject it.
- Report the Results : Summarize and present the outcomes in your report’s results and discussion sections.
While the specifics of these steps can vary depending on the research context and the data type, the fundamental process of hypothesis testing remains consistent across different studies.
Let’s work through these steps in an example!
Hypothesis Testing Example
Researchers want to determine if a new educational program improves student performance on standardized tests. They randomly assign 30 students to a control group , which follows the standard curriculum, and another 30 students to a treatment group, which participates in the new educational program. After a semester, they compare the test scores of both groups.
Download the CSV data file to perform the hypothesis testing yourself: Hypothesis_Testing .
The researchers write their hypotheses. These statements apply to the population, so they use the mu (μ) symbol for the population mean parameter .
- Null Hypothesis (H 0 ) : The population means of the test scores for the two groups are equal (μ 1 = μ 2 ).
- Alternative Hypothesis (H A ) : The population means of the test scores for the two groups are unequal (μ 1 ≠ μ 2 ).
Choosing the correct hypothesis test depends on attributes such as data type and number of groups. Because they’re using continuous data and comparing two means, the researchers use a 2-sample t-test .
Here are the results.

The treatment group’s mean is 58.70, compared to the control group’s mean of 48.12. The mean difference is 10.67 points. Use the test’s p-value and significance level to determine whether this difference is likely a product of random fluctuation in the sample or a genuine population effect.
Because the p-value (0.000) is less than the standard significance level of 0.05, the results are statistically significant, and we can reject the null hypothesis. The sample data provides sufficient evidence to conclude that the new program’s effect exists in the population.
Limitations
Hypothesis testing improves your effectiveness in making data-driven decisions. However, it is not 100% accurate because random samples occasionally produce fluky results. Hypothesis tests have two types of errors, both relating to drawing incorrect conclusions.
- Type I error: The test rejects a true null hypothesis—a false positive.
- Type II error: The test fails to reject a false null hypothesis—a false negative.
Learn more about Type I and Type II Errors .
Our exploration of hypothesis testing using a practical example of an educational program reveals its powerful ability to guide decisions based on statistical evidence. Whether you’re a student, researcher, or professional, understanding and applying these procedures can open new doors to discovering insights and making informed decisions. Let this tool empower your analytical endeavors as you navigate through the vast seas of data.
Learn more about the Hypothesis Tests for Various Data Types .
Share this:

Reader Interactions

June 10, 2024 at 10:51 am
Thank you, Jim, for another helpful article; timely too since I have started reading your new book on hypothesis testing and, now that we are at the end of the school year, my district is asking me to perform a number of evaluations on instructional programs. This is where my question/concern comes in. You mention that hypothesis testing is all about testing samples. However, I use all the students in my district when I make these comparisons. Since I am using the entire “population” in my evaluations (I don’t select a sample of third grade students, for example, but I use all 700 third graders), am I somehow misusing the tests? Or can I rest assured that my district’s student population is only a sample of the universal population of students?

June 10, 2024 at 1:50 pm
I hope you are finding the book helpful!
Yes, the purpose of hypothesis testing is to infer the properties of a population while accounting for random sampling error.
In your case, it comes down to how you want to use the results. Who do you want the results to apply to?
If you’re summarizing the sample, looking for trends and patterns, or evaluating those students and don’t plan to apply those results to other students, you don’t need hypothesis testing because there is no sampling error. They are the population and you can just use descriptive statistics. In this case, you’d only need to focus on the practical significance of the effect sizes.
On the other hand, if you want to apply the results from this group to other students, you’ll need hypothesis testing. However, there is the complicating issue of what population your sample of students represent. I’m sure your district has its own unique characteristics, demographics, etc. Your district’s students probably don’t adequately represent a universal population. At the very least, you’d need to recognize any special attributes of your district and how they could bias the results when trying to apply them outside the district. Or they might apply to similar districts in your region.
However, I’d imagine your 3rd graders probably adequately represent future classes of 3rd graders in your district. You need to be alert to changing demographics. At least in the short run I’d imagine they’d be representative of future classes.
Think about how these results will be used. Do they just apply to the students you measured? Then you don’t need hypothesis tests. However, if the results are being used to infer things about other students outside of the sample, you’ll need hypothesis testing along with considering how well your students represent the other students and how they differ.
I hope that helps!
June 10, 2024 at 3:21 pm
Thank you so much, Jim, for the suggestions in terms of what I need to think about and consider! You are always so clear in your explanations!!!!
June 10, 2024 at 3:22 pm
You’re very welcome! Best of luck with your evaluations!
Comments and Questions Cancel reply
- How it works

Hypothesis Testing – A Complete Guide with Examples
Published by Alvin Nicolas at August 14th, 2021 , Revised On October 26, 2023
In statistics, hypothesis testing is a critical tool. It allows us to make informed decisions about populations based on sample data. Whether you are a researcher trying to prove a scientific point, a marketer analysing A/B test results, or a manufacturer ensuring quality control, hypothesis testing plays a pivotal role. This guide aims to introduce you to the concept and walk you through real-world examples.
What is a Hypothesis and a Hypothesis Testing?
A hypothesis is considered a belief or assumption that has to be accepted, rejected, proved or disproved. In contrast, a research hypothesis is a research question for a researcher that has to be proven correct or incorrect through investigation.
What is Hypothesis Testing?
Hypothesis testing is a scientific method used for making a decision and drawing conclusions by using a statistical approach. It is used to suggest new ideas by testing theories to know whether or not the sample data supports research. A research hypothesis is a predictive statement that has to be tested using scientific methods that join an independent variable to a dependent variable.
Example: The academic performance of student A is better than student B
Characteristics of the Hypothesis to be Tested
A hypothesis should be:
- Clear and precise
- Capable of being tested
- Able to relate to a variable
- Stated in simple terms
- Consistent with known facts
- Limited in scope and specific
- Tested in a limited timeframe
- Explain the facts in detail
What is a Null Hypothesis and Alternative Hypothesis?
A null hypothesis is a hypothesis when there is no significant relationship between the dependent and the participants’ independent variables .
In simple words, it’s a hypothesis that has been put forth but hasn’t been proved as yet. A researcher aims to disprove the theory. The abbreviation “Ho” is used to denote a null hypothesis.
If you want to compare two methods and assume that both methods are equally good, this assumption is considered the null hypothesis.
Example: In an automobile trial, you feel that the new vehicle’s mileage is similar to the previous model of the car, on average. You can write it as: Ho: there is no difference between the mileage of both vehicles. If your findings don’t support your hypothesis and you get opposite results, this outcome will be considered an alternative hypothesis.
If you assume that one method is better than another method, then it’s considered an alternative hypothesis. The alternative hypothesis is the theory that a researcher seeks to prove and is typically denoted by H1 or HA.
If you support a null hypothesis, it means you’re not supporting the alternative hypothesis. Similarly, if you reject a null hypothesis, it means you are recommending the alternative hypothesis.
Example: In an automobile trial, you feel that the new vehicle’s mileage is better than the previous model of the vehicle. You can write it as; Ha: the two vehicles have different mileage. On average/ the fuel consumption of the new vehicle model is better than the previous model.
If a null hypothesis is rejected during the hypothesis test, even if it’s true, then it is considered as a type-I error. On the other hand, if you don’t dismiss a hypothesis, even if it’s false because you could not identify its falseness, it’s considered a type-II error.
Hire an Expert Researcher
Orders completed by our expert writers are
- Formally drafted in academic style
- 100% Plagiarism free & 100% Confidential
- Never resold
- Include unlimited free revisions
- Completed to match exact client requirements

How to Conduct Hypothesis Testing?
Here is a step-by-step guide on how to conduct hypothesis testing.
Step 1: State the Null and Alternative Hypothesis
Once you develop a research hypothesis, it’s important to state it is as a Null hypothesis (Ho) and an Alternative hypothesis (Ha) to test it statistically.
A null hypothesis is a preferred choice as it provides the opportunity to test the theory. In contrast, you can accept the alternative hypothesis when the null hypothesis has been rejected.
Example: You want to identify a relationship between obesity of men and women and the modern living style. You develop a hypothesis that women, on average, gain weight quickly compared to men. Then you write it as: Ho: Women, on average, don’t gain weight quickly compared to men. Ha: Women, on average, gain weight quickly compared to men.
Step 2: Data Collection
Hypothesis testing follows the statistical method, and statistics are all about data. It’s challenging to gather complete information about a specific population you want to study. You need to gather the data obtained through a large number of samples from a specific population.
Example: Suppose you want to test the difference in the rate of obesity between men and women. You should include an equal number of men and women in your sample. Then investigate various aspects such as their lifestyle, eating patterns and profession, and any other variables that may influence average weight. You should also determine your study’s scope, whether it applies to a specific group of population or worldwide population. You can use available information from various places, countries, and regions.
Step 3: Select Appropriate Statistical Test
There are many types of statistical tests , but we discuss the most two common types below, such as One-sided and two-sided tests.
Note: Your choice of the type of test depends on the purpose of your study
One-sided Test
In the one-sided test, the values of rejecting a null hypothesis are located in one tail of the probability distribution. The set of values is less or higher than the critical value of the test. It is also called a one-tailed test of significance.
Example: If you want to test that all mangoes in a basket are ripe. You can write it as: Ho: All mangoes in the basket, on average, are ripe. If you find all ripe mangoes in the basket, the null hypothesis you developed will be true.
Two-sided Test
In the two-sided test, the values of rejecting a null hypothesis are located on both tails of the probability distribution. The set of values is less or higher than the first critical value of the test and higher than the second critical value test. It is also called a two-tailed test of significance.
Example: Nothing can be explicitly said whether all mangoes are ripe in the basket. If you reject the null hypothesis (Ho: All mangoes in the basket, on average, are ripe), then it means all mangoes in the basket are not likely to be ripe. A few mangoes could be raw as well.
Get statistical analysis help at an affordable price
- An expert statistician will complete your work
- Rigorous quality checks
- Confidentiality and reliability
- Any statistical software of your choice
- Free Plagiarism Report

Step 4: Select the Level of Significance
When you reject a null hypothesis, even if it’s true during a statistical hypothesis, it is considered the significance level . It is the probability of a type one error. The significance should be as minimum as possible to avoid the type-I error, which is considered severe and should be avoided.
If the significance level is minimum, then it prevents the researchers from false claims.
The significance level is denoted by P, and it has given the value of 0.05 (P=0.05)
If the P-Value is less than 0.05, then the difference will be significant. If the P-value is higher than 0.05, then the difference is non-significant.
Example: Suppose you apply a one-sided test to test whether women gain weight quickly compared to men. You get to know about the average weight between men and women and the factors promoting weight gain.
Step 5: Find out Whether the Null Hypothesis is Rejected or Supported
After conducting a statistical test, you should identify whether your null hypothesis is rejected or accepted based on the test results. It would help if you observed the P-value for this.
Example: If you find the P-value of your test is less than 0.5/5%, then you need to reject your null hypothesis (Ho: Women, on average, don’t gain weight quickly compared to men). On the other hand, if a null hypothesis is rejected, then it means the alternative hypothesis might be true (Ha: Women, on average, gain weight quickly compared to men. If you find your test’s P-value is above 0.5/5%, then it means your null hypothesis is true.
Step 6: Present the Outcomes of your Study
The final step is to present the outcomes of your study . You need to ensure whether you have met the objectives of your research or not.
In the discussion section and conclusion , you can present your findings by using supporting evidence and conclude whether your null hypothesis was rejected or supported.
In the result section, you can summarise your study’s outcomes, including the average difference and P-value of the two groups.
If we talk about the findings, our study your results will be as follows:
Example: In the study of identifying whether women gain weight quickly compared to men, we found the P-value is less than 0.5. Hence, we can reject the null hypothesis (Ho: Women, on average, don’t gain weight quickly than men) and conclude that women may likely gain weight quickly than men.
Did you know in your academic paper you should not mention whether you have accepted or rejected the null hypothesis?
Always remember that you either conclude to reject Ho in favor of Haor do not reject Ho . It would help if you never rejected Ha or even accept Ha .
Suppose your null hypothesis is rejected in the hypothesis testing. If you conclude reject Ho in favor of Haor do not reject Ho, then it doesn’t mean that the null hypothesis is true. It only means that there is a lack of evidence against Ho in favour of Ha. If your null hypothesis is not true, then the alternative hypothesis is likely to be true.
Example: We found that the P-value is less than 0.5. Hence, we can conclude reject Ho in favour of Ha (Ho: Women, on average, don’t gain weight quickly than men) reject Ho in favour of Ha. However, rejected in favour of Ha means (Ha: women may likely to gain weight quickly than men)
Frequently Asked Questions
What are the 3 types of hypothesis test.
The 3 types of hypothesis tests are:
- One-Sample Test : Compare sample data to a known population value.
- Two-Sample Test : Compare means between two sample groups.
- ANOVA : Analyze variance among multiple groups to determine significant differences.
What is a hypothesis?
A hypothesis is a proposed explanation or prediction about a phenomenon, often based on observations. It serves as a starting point for research or experimentation, providing a testable statement that can either be supported or refuted through data and analysis. In essence, it’s an educated guess that drives scientific inquiry.
What are null hypothesis?
A null hypothesis (often denoted as H0) suggests that there is no effect or difference in a study or experiment. It represents a default position or status quo. Statistical tests evaluate data to determine if there’s enough evidence to reject this null hypothesis.
What is the probability value?
The probability value, or p-value, is a measure used in statistics to determine the significance of an observed effect. It indicates the probability of obtaining the observed results, or more extreme, if the null hypothesis were true. A small p-value (typically <0.05) suggests evidence against the null hypothesis, warranting its rejection.
What is p value?
The p-value is a fundamental concept in statistical hypothesis testing. It represents the probability of observing a test statistic as extreme, or more so, than the one calculated from sample data, assuming the null hypothesis is true. A low p-value suggests evidence against the null, possibly justifying its rejection.
What is a t test?
A t-test is a statistical test used to compare the means of two groups. It determines if observed differences between the groups are statistically significant or if they likely occurred by chance. Commonly applied in research, there are different t-tests, including independent, paired, and one-sample, tailored to various data scenarios.
When to reject null hypothesis?
Reject the null hypothesis when the test statistic falls into a predefined rejection region or when the p-value is less than the chosen significance level (commonly 0.05). This suggests that the observed data is unlikely under the null hypothesis, indicating evidence for the alternative hypothesis. Always consider the study’s context.
You May Also Like
What are the different types of research you can use in your dissertation? Here are some guidelines to help you choose a research strategy that would make your research more credible.
The authenticity of dissertation is largely influenced by the research method employed. Here we present the most notable research methods for dissertation.
USEFUL LINKS
LEARNING RESOURCES

COMPANY DETAILS

- How It Works

User Preferences
Content preview.
Arcu felis bibendum ut tristique et egestas quis:
- Ut enim ad minim veniam, quis nostrud exercitation ullamco laboris
- Duis aute irure dolor in reprehenderit in voluptate
- Excepteur sint occaecat cupidatat non proident
Keyboard Shortcuts
S.3 hypothesis testing.
In reviewing hypothesis tests, we start first with the general idea. Then, we keep returning to the basic procedures of hypothesis testing, each time adding a little more detail.
The general idea of hypothesis testing involves:
- Making an initial assumption.
- Collecting evidence (data).
- Based on the available evidence (data), deciding whether to reject or not reject the initial assumption.
Every hypothesis test — regardless of the population parameter involved — requires the above three steps.
Example S.3.1
Is normal body temperature really 98.6 degrees f section .
Consider the population of many, many adults. A researcher hypothesized that the average adult body temperature is lower than the often-advertised 98.6 degrees F. That is, the researcher wants an answer to the question: "Is the average adult body temperature 98.6 degrees? Or is it lower?" To answer his research question, the researcher starts by assuming that the average adult body temperature was 98.6 degrees F.
Then, the researcher went out and tried to find evidence that refutes his initial assumption. In doing so, he selects a random sample of 130 adults. The average body temperature of the 130 sampled adults is 98.25 degrees.
Then, the researcher uses the data he collected to make a decision about his initial assumption. It is either likely or unlikely that the researcher would collect the evidence he did given his initial assumption that the average adult body temperature is 98.6 degrees:
- If it is likely , then the researcher does not reject his initial assumption that the average adult body temperature is 98.6 degrees. There is not enough evidence to do otherwise.
- either the researcher's initial assumption is correct and he experienced a very unusual event;
- or the researcher's initial assumption is incorrect.
In statistics, we generally don't make claims that require us to believe that a very unusual event happened. That is, in the practice of statistics, if the evidence (data) we collected is unlikely in light of the initial assumption, then we reject our initial assumption.
Example S.3.2
Criminal trial analogy section .
One place where you can consistently see the general idea of hypothesis testing in action is in criminal trials held in the United States. Our criminal justice system assumes "the defendant is innocent until proven guilty." That is, our initial assumption is that the defendant is innocent.
In the practice of statistics, we make our initial assumption when we state our two competing hypotheses -- the null hypothesis ( H 0 ) and the alternative hypothesis ( H A ). Here, our hypotheses are:
- H 0 : Defendant is not guilty (innocent)
- H A : Defendant is guilty
In statistics, we always assume the null hypothesis is true . That is, the null hypothesis is always our initial assumption.
The prosecution team then collects evidence — such as finger prints, blood spots, hair samples, carpet fibers, shoe prints, ransom notes, and handwriting samples — with the hopes of finding "sufficient evidence" to make the assumption of innocence refutable.
In statistics, the data are the evidence.
The jury then makes a decision based on the available evidence:
- If the jury finds sufficient evidence — beyond a reasonable doubt — to make the assumption of innocence refutable, the jury rejects the null hypothesis and deems the defendant guilty. We behave as if the defendant is guilty.
- If there is insufficient evidence, then the jury does not reject the null hypothesis . We behave as if the defendant is innocent.
In statistics, we always make one of two decisions. We either "reject the null hypothesis" or we "fail to reject the null hypothesis."
Errors in Hypothesis Testing Section
Did you notice the use of the phrase "behave as if" in the previous discussion? We "behave as if" the defendant is guilty; we do not "prove" that the defendant is guilty. And, we "behave as if" the defendant is innocent; we do not "prove" that the defendant is innocent.
This is a very important distinction! We make our decision based on evidence not on 100% guaranteed proof. Again:
- If we reject the null hypothesis, we do not prove that the alternative hypothesis is true.
- If we do not reject the null hypothesis, we do not prove that the null hypothesis is true.
We merely state that there is enough evidence to behave one way or the other. This is always true in statistics! Because of this, whatever the decision, there is always a chance that we made an error .
Let's review the two types of errors that can be made in criminal trials:
| Jury Decision | Truth | ||
|---|---|---|---|
| Not Guilty | Guilty | ||
| Not Guilty | OK | ERROR | |
| Guilty | ERROR | OK | |
Table S.3.2 shows how this corresponds to the two types of errors in hypothesis testing.
| Decision | |||
|---|---|---|---|
| Null Hypothesis | Alternative Hypothesis | ||
| Do not Reject Null | OK | Type II Error | |
| Reject Null | Type I Error | OK | |
Note that, in statistics, we call the two types of errors by two different names -- one is called a "Type I error," and the other is called a "Type II error." Here are the formal definitions of the two types of errors:
There is always a chance of making one of these errors. But, a good scientific study will minimize the chance of doing so!
Making the Decision Section
Recall that it is either likely or unlikely that we would observe the evidence we did given our initial assumption. If it is likely , we do not reject the null hypothesis. If it is unlikely , then we reject the null hypothesis in favor of the alternative hypothesis. Effectively, then, making the decision reduces to determining "likely" or "unlikely."
In statistics, there are two ways to determine whether the evidence is likely or unlikely given the initial assumption:
- We could take the " critical value approach " (favored in many of the older textbooks).
- Or, we could take the " P -value approach " (what is used most often in research, journal articles, and statistical software).
In the next two sections, we review the procedures behind each of these two approaches. To make our review concrete, let's imagine that μ is the average grade point average of all American students who major in mathematics. We first review the critical value approach for conducting each of the following three hypothesis tests about the population mean $\mu$:
| : = 3 | : > 3 | |
| : = 3 | : < 3 | |
| : = 3 | : ≠ 3 |
In Practice
- We would want to conduct the first hypothesis test if we were interested in concluding that the average grade point average of the group is more than 3.
- We would want to conduct the second hypothesis test if we were interested in concluding that the average grade point average of the group is less than 3.
- And, we would want to conduct the third hypothesis test if we were only interested in concluding that the average grade point average of the group differs from 3 (without caring whether it is more or less than 3).
Upon completing the review of the critical value approach, we review the P -value approach for conducting each of the above three hypothesis tests about the population mean \(\mu\). The procedures that we review here for both approaches easily extend to hypothesis tests about any other population parameter.
Have a language expert improve your writing
Run a free plagiarism check in 10 minutes, generate accurate citations for free.
- Knowledge Base
Methodology
- How to Write a Strong Hypothesis | Steps & Examples
How to Write a Strong Hypothesis | Steps & Examples
Published on May 6, 2022 by Shona McCombes . Revised on November 20, 2023.
A hypothesis is a statement that can be tested by scientific research. If you want to test a relationship between two or more variables, you need to write hypotheses before you start your experiment or data collection .
Example: Hypothesis
Daily apple consumption leads to fewer doctor’s visits.
Table of contents
What is a hypothesis, developing a hypothesis (with example), hypothesis examples, other interesting articles, frequently asked questions about writing hypotheses.
A hypothesis states your predictions about what your research will find. It is a tentative answer to your research question that has not yet been tested. For some research projects, you might have to write several hypotheses that address different aspects of your research question.
A hypothesis is not just a guess – it should be based on existing theories and knowledge. It also has to be testable, which means you can support or refute it through scientific research methods (such as experiments, observations and statistical analysis of data).
Variables in hypotheses
Hypotheses propose a relationship between two or more types of variables .
- An independent variable is something the researcher changes or controls.
- A dependent variable is something the researcher observes and measures.
If there are any control variables , extraneous variables , or confounding variables , be sure to jot those down as you go to minimize the chances that research bias will affect your results.
In this example, the independent variable is exposure to the sun – the assumed cause . The dependent variable is the level of happiness – the assumed effect .
Receive feedback on language, structure, and formatting
Professional editors proofread and edit your paper by focusing on:
- Academic style
- Vague sentences
- Style consistency
See an example

Step 1. Ask a question
Writing a hypothesis begins with a research question that you want to answer. The question should be focused, specific, and researchable within the constraints of your project.
Step 2. Do some preliminary research
Your initial answer to the question should be based on what is already known about the topic. Look for theories and previous studies to help you form educated assumptions about what your research will find.
At this stage, you might construct a conceptual framework to ensure that you’re embarking on a relevant topic . This can also help you identify which variables you will study and what you think the relationships are between them. Sometimes, you’ll have to operationalize more complex constructs.
Step 3. Formulate your hypothesis
Now you should have some idea of what you expect to find. Write your initial answer to the question in a clear, concise sentence.
4. Refine your hypothesis
You need to make sure your hypothesis is specific and testable. There are various ways of phrasing a hypothesis, but all the terms you use should have clear definitions, and the hypothesis should contain:
- The relevant variables
- The specific group being studied
- The predicted outcome of the experiment or analysis
5. Phrase your hypothesis in three ways
To identify the variables, you can write a simple prediction in if…then form. The first part of the sentence states the independent variable and the second part states the dependent variable.
In academic research, hypotheses are more commonly phrased in terms of correlations or effects, where you directly state the predicted relationship between variables.
If you are comparing two groups, the hypothesis can state what difference you expect to find between them.
6. Write a null hypothesis
If your research involves statistical hypothesis testing , you will also have to write a null hypothesis . The null hypothesis is the default position that there is no association between the variables. The null hypothesis is written as H 0 , while the alternative hypothesis is H 1 or H a .
- H 0 : The number of lectures attended by first-year students has no effect on their final exam scores.
- H 1 : The number of lectures attended by first-year students has a positive effect on their final exam scores.
| Research question | Hypothesis | Null hypothesis |
|---|---|---|
| What are the health benefits of eating an apple a day? | Increasing apple consumption in over-60s will result in decreasing frequency of doctor’s visits. | Increasing apple consumption in over-60s will have no effect on frequency of doctor’s visits. |
| Which airlines have the most delays? | Low-cost airlines are more likely to have delays than premium airlines. | Low-cost and premium airlines are equally likely to have delays. |
| Can flexible work arrangements improve job satisfaction? | Employees who have flexible working hours will report greater job satisfaction than employees who work fixed hours. | There is no relationship between working hour flexibility and job satisfaction. |
| How effective is high school sex education at reducing teen pregnancies? | Teenagers who received sex education lessons throughout high school will have lower rates of unplanned pregnancy teenagers who did not receive any sex education. | High school sex education has no effect on teen pregnancy rates. |
| What effect does daily use of social media have on the attention span of under-16s? | There is a negative between time spent on social media and attention span in under-16s. | There is no relationship between social media use and attention span in under-16s. |
If you want to know more about the research process , methodology , research bias , or statistics , make sure to check out some of our other articles with explanations and examples.
- Sampling methods
- Simple random sampling
- Stratified sampling
- Cluster sampling
- Likert scales
- Reproducibility
Statistics
- Null hypothesis
- Statistical power
- Probability distribution
- Effect size
- Poisson distribution
Research bias
- Optimism bias
- Cognitive bias
- Implicit bias
- Hawthorne effect
- Anchoring bias
- Explicit bias
A hypothesis is not just a guess — it should be based on existing theories and knowledge. It also has to be testable, which means you can support or refute it through scientific research methods (such as experiments, observations and statistical analysis of data).
Null and alternative hypotheses are used in statistical hypothesis testing . The null hypothesis of a test always predicts no effect or no relationship between variables, while the alternative hypothesis states your research prediction of an effect or relationship.
Hypothesis testing is a formal procedure for investigating our ideas about the world using statistics. It is used by scientists to test specific predictions, called hypotheses , by calculating how likely it is that a pattern or relationship between variables could have arisen by chance.
Cite this Scribbr article
If you want to cite this source, you can copy and paste the citation or click the “Cite this Scribbr article” button to automatically add the citation to our free Citation Generator.
McCombes, S. (2023, November 20). How to Write a Strong Hypothesis | Steps & Examples. Scribbr. Retrieved August 26, 2024, from https://www.scribbr.com/methodology/hypothesis/
Is this article helpful?

Shona McCombes
Other students also liked, construct validity | definition, types, & examples, what is a conceptual framework | tips & examples, operationalization | a guide with examples, pros & cons, what is your plagiarism score.
Tutorial Playlist
Statistics tutorial, everything you need to know about the probability density function in statistics, the best guide to understand central limit theorem, an in-depth guide to measures of central tendency : mean, median and mode, the ultimate guide to understand conditional probability.
A Comprehensive Look at Percentile in Statistics
The Best Guide to Understand Bayes Theorem
Everything you need to know about the normal distribution, an in-depth explanation of cumulative distribution function, a complete guide to chi-square test, what is hypothesis testing in statistics types and examples, understanding the fundamentals of arithmetic and geometric progression, the definitive guide to understand spearman’s rank correlation, mean squared error: overview, examples, concepts and more, all you need to know about the empirical rule in statistics, the complete guide to skewness and kurtosis, a holistic look at bernoulli distribution.
All You Need to Know About Bias in Statistics
A Complete Guide to Get a Grasp of Time Series Analysis
The Key Differences Between Z-Test Vs. T-Test
The Complete Guide to Understand Pearson's Correlation
A complete guide on the types of statistical studies, everything you need to know about poisson distribution, your best guide to understand correlation vs. regression, the most comprehensive guide for beginners on what is correlation, hypothesis testing in statistics - types | examples.
Lesson 10 of 24 By Avijeet Biswal

Table of Contents
In today’s data-driven world, decisions are based on data all the time. Hypothesis plays a crucial role in that process, whether it may be making business decisions, in the health sector, academia, or in quality improvement. Without hypothesis & hypothesis tests, you risk drawing the wrong conclusions and making bad decisions. In this tutorial, you will look at Hypothesis Testing in Statistics.
The Ultimate Ticket to Top Data Science Job Roles
What Is Hypothesis Testing in Statistics?
Hypothesis Testing is a type of statistical analysis in which you put your assumptions about a population parameter to the test. It is used to estimate the relationship between 2 statistical variables.
Let's discuss few examples of statistical hypothesis from real-life -
- A teacher assumes that 60% of his college's students come from lower-middle-class families.
- A doctor believes that 3D (Diet, Dose, and Discipline) is 90% effective for diabetic patients.
Now that you know about hypothesis testing, look at the two types of hypothesis testing in statistics.
Hypothesis Testing Formula
Z = ( x̅ – μ0 ) / (σ /√n)
- Here, x̅ is the sample mean,
- μ0 is the population mean,
- σ is the standard deviation,
- n is the sample size.
How Hypothesis Testing Works?
An analyst performs hypothesis testing on a statistical sample to present evidence of the plausibility of the null hypothesis. Measurements and analyses are conducted on a random sample of the population to test a theory. Analysts use a random population sample to test two hypotheses: the null and alternative hypotheses.
The null hypothesis is typically an equality hypothesis between population parameters; for example, a null hypothesis may claim that the population means return equals zero. The alternate hypothesis is essentially the inverse of the null hypothesis (e.g., the population means the return is not equal to zero). As a result, they are mutually exclusive, and only one can be correct. One of the two possibilities, however, will always be correct.
Your Dream Career is Just Around The Corner!
Null Hypothesis and Alternative Hypothesis
The Null Hypothesis is the assumption that the event will not occur. A null hypothesis has no bearing on the study's outcome unless it is rejected.
H0 is the symbol for it, and it is pronounced H-naught.
The Alternate Hypothesis is the logical opposite of the null hypothesis. The acceptance of the alternative hypothesis follows the rejection of the null hypothesis. H1 is the symbol for it.
Let's understand this with an example.
A sanitizer manufacturer claims that its product kills 95 percent of germs on average.
To put this company's claim to the test, create a null and alternate hypothesis.
H0 (Null Hypothesis): Average = 95%.
Alternative Hypothesis (H1): The average is less than 95%.
Another straightforward example to understand this concept is determining whether or not a coin is fair and balanced. The null hypothesis states that the probability of a show of heads is equal to the likelihood of a show of tails. In contrast, the alternate theory states that the probability of a show of heads and tails would be very different.
Become a Data Scientist with Hands-on Training!
Hypothesis Testing Calculation With Examples
Let's consider a hypothesis test for the average height of women in the United States. Suppose our null hypothesis is that the average height is 5'4". We gather a sample of 100 women and determine that their average height is 5'5". The standard deviation of population is 2.
To calculate the z-score, we would use the following formula:
z = ( x̅ – μ0 ) / (σ /√n)
z = (5'5" - 5'4") / (2" / √100)
z = 0.5 / (0.045)
We will reject the null hypothesis as the z-score of 11.11 is very large and conclude that there is evidence to suggest that the average height of women in the US is greater than 5'4".
Steps in Hypothesis Testing
Hypothesis testing is a statistical method to determine if there is enough evidence in a sample of data to infer that a certain condition is true for the entire population. Here’s a breakdown of the typical steps involved in hypothesis testing:
Formulate Hypotheses
- Null Hypothesis (H0): This hypothesis states that there is no effect or difference, and it is the hypothesis you attempt to reject with your test.
- Alternative Hypothesis (H1 or Ha): This hypothesis is what you might believe to be true or hope to prove true. It is usually considered the opposite of the null hypothesis.
Choose the Significance Level (α)
The significance level, often denoted by alpha (α), is the probability of rejecting the null hypothesis when it is true. Common choices for α are 0.05 (5%), 0.01 (1%), and 0.10 (10%).
Select the Appropriate Test
Choose a statistical test based on the type of data and the hypothesis. Common tests include t-tests, chi-square tests, ANOVA, and regression analysis. The selection depends on data type, distribution, sample size, and whether the hypothesis is one-tailed or two-tailed.
Collect Data
Gather the data that will be analyzed in the test. This data should be representative of the population to infer conclusions accurately.
Calculate the Test Statistic
Based on the collected data and the chosen test, calculate a test statistic that reflects how much the observed data deviates from the null hypothesis.
Determine the p-value
The p-value is the probability of observing test results at least as extreme as the results observed, assuming the null hypothesis is correct. It helps determine the strength of the evidence against the null hypothesis.
Make a Decision
Compare the p-value to the chosen significance level:
- If the p-value ≤ α: Reject the null hypothesis, suggesting sufficient evidence in the data supports the alternative hypothesis.
- If the p-value > α: Do not reject the null hypothesis, suggesting insufficient evidence to support the alternative hypothesis.
Report the Results
Present the findings from the hypothesis test, including the test statistic, p-value, and the conclusion about the hypotheses.
Perform Post-hoc Analysis (if necessary)
Depending on the results and the study design, further analysis may be needed to explore the data more deeply or to address multiple comparisons if several hypotheses were tested simultaneously.
Types of Hypothesis Testing
To determine whether a discovery or relationship is statistically significant, hypothesis testing uses a z-test. It usually checks to see if two means are the same (the null hypothesis). Only when the population standard deviation is known and the sample size is 30 data points or more, can a z-test be applied.
A statistical test called a t-test is employed to compare the means of two groups. To determine whether two groups differ or if a procedure or treatment affects the population of interest, it is frequently used in hypothesis testing.
Chi-Square
You utilize a Chi-square test for hypothesis testing concerning whether your data is as predicted. To determine if the expected and observed results are well-fitted, the Chi-square test analyzes the differences between categorical variables from a random sample. The test's fundamental premise is that the observed values in your data should be compared to the predicted values that would be present if the null hypothesis were true.
Hypothesis Testing and Confidence Intervals
Both confidence intervals and hypothesis tests are inferential techniques that depend on approximating the sample distribution. Data from a sample is used to estimate a population parameter using confidence intervals. Data from a sample is used in hypothesis testing to examine a given hypothesis. We must have a postulated parameter to conduct hypothesis testing.
Bootstrap distributions and randomization distributions are created using comparable simulation techniques. The observed sample statistic is the focal point of a bootstrap distribution, whereas the null hypothesis value is the focal point of a randomization distribution.
A variety of feasible population parameter estimates are included in confidence ranges. In this lesson, we created just two-tailed confidence intervals. There is a direct connection between these two-tail confidence intervals and these two-tail hypothesis tests. The results of a two-tailed hypothesis test and two-tailed confidence intervals typically provide the same results. In other words, a hypothesis test at the 0.05 level will virtually always fail to reject the null hypothesis if the 95% confidence interval contains the predicted value. A hypothesis test at the 0.05 level will nearly certainly reject the null hypothesis if the 95% confidence interval does not include the hypothesized parameter.
Become a Data Scientist through hands-on learning with hackathons, masterclasses, webinars, and Ask-Me-Anything! Start learning now!
Simple and Composite Hypothesis Testing
Depending on the population distribution, you can classify the statistical hypothesis into two types.
Simple Hypothesis: A simple hypothesis specifies an exact value for the parameter.
Composite Hypothesis: A composite hypothesis specifies a range of values.
A company is claiming that their average sales for this quarter are 1000 units. This is an example of a simple hypothesis.
Suppose the company claims that the sales are in the range of 900 to 1000 units. Then this is a case of a composite hypothesis.
One-Tailed and Two-Tailed Hypothesis Testing
The One-Tailed test, also called a directional test, considers a critical region of data that would result in the null hypothesis being rejected if the test sample falls into it, inevitably meaning the acceptance of the alternate hypothesis.
In a one-tailed test, the critical distribution area is one-sided, meaning the test sample is either greater or lesser than a specific value.
In two tails, the test sample is checked to be greater or less than a range of values in a Two-Tailed test, implying that the critical distribution area is two-sided.
If the sample falls within this range, the alternate hypothesis will be accepted, and the null hypothesis will be rejected.
Become a Data Scientist With Real-World Experience
Right Tailed Hypothesis Testing
If the larger than (>) sign appears in your hypothesis statement, you are using a right-tailed test, also known as an upper test. Or, to put it another way, the disparity is to the right. For instance, you can contrast the battery life before and after a change in production. Your hypothesis statements can be the following if you want to know if the battery life is longer than the original (let's say 90 hours):
- The null hypothesis is (H0 <= 90) or less change.
- A possibility is that battery life has risen (H1) > 90.
The crucial point in this situation is that the alternate hypothesis (H1), not the null hypothesis, decides whether you get a right-tailed test.
Left Tailed Hypothesis Testing
Alternative hypotheses that assert the true value of a parameter is lower than the null hypothesis are tested with a left-tailed test; they are indicated by the asterisk "<".
Suppose H0: mean = 50 and H1: mean not equal to 50
According to the H1, the mean can be greater than or less than 50. This is an example of a Two-tailed test.
In a similar manner, if H0: mean >=50, then H1: mean <50
Here the mean is less than 50. It is called a One-tailed test.
Type 1 and Type 2 Error
A hypothesis test can result in two types of errors.
Type 1 Error: A Type-I error occurs when sample results reject the null hypothesis despite being true.
Type 2 Error: A Type-II error occurs when the null hypothesis is not rejected when it is false, unlike a Type-I error.
Suppose a teacher evaluates the examination paper to decide whether a student passes or fails.
H0: Student has passed
H1: Student has failed
Type I error will be the teacher failing the student [rejects H0] although the student scored the passing marks [H0 was true].
Type II error will be the case where the teacher passes the student [do not reject H0] although the student did not score the passing marks [H1 is true].
Our Data Scientist Master's Program covers core topics such as R, Python, Machine Learning, Tableau, Hadoop, and Spark. Get started on your journey today!
Limitations of Hypothesis Testing
Hypothesis testing has some limitations that researchers should be aware of:
- It cannot prove or establish the truth: Hypothesis testing provides evidence to support or reject a hypothesis, but it cannot confirm the absolute truth of the research question.
- Results are sample-specific: Hypothesis testing is based on analyzing a sample from a population, and the conclusions drawn are specific to that particular sample.
- Possible errors: During hypothesis testing, there is a chance of committing type I error (rejecting a true null hypothesis) or type II error (failing to reject a false null hypothesis).
- Assumptions and requirements: Different tests have specific assumptions and requirements that must be met to accurately interpret results.
Learn All The Tricks Of The BI Trade
After reading this tutorial, you would have a much better understanding of hypothesis testing, one of the most important concepts in the field of Data Science . The majority of hypotheses are based on speculation about observed behavior, natural phenomena, or established theories.
If you are interested in statistics of data science and skills needed for such a career, you ought to explore the Post Graduate Program in Data Science.
If you have any questions regarding this ‘Hypothesis Testing In Statistics’ tutorial, do share them in the comment section. Our subject matter expert will respond to your queries. Happy learning!
1. What is hypothesis testing in statistics with example?
Hypothesis testing is a statistical method used to determine if there is enough evidence in a sample data to draw conclusions about a population. It involves formulating two competing hypotheses, the null hypothesis (H0) and the alternative hypothesis (Ha), and then collecting data to assess the evidence. An example: testing if a new drug improves patient recovery (Ha) compared to the standard treatment (H0) based on collected patient data.
2. What is H0 and H1 in statistics?
In statistics, H0 and H1 represent the null and alternative hypotheses. The null hypothesis, H0, is the default assumption that no effect or difference exists between groups or conditions. The alternative hypothesis, H1, is the competing claim suggesting an effect or a difference. Statistical tests determine whether to reject the null hypothesis in favor of the alternative hypothesis based on the data.
3. What is a simple hypothesis with an example?
A simple hypothesis is a specific statement predicting a single relationship between two variables. It posits a direct and uncomplicated outcome. For example, a simple hypothesis might state, "Increased sunlight exposure increases the growth rate of sunflowers." Here, the hypothesis suggests a direct relationship between the amount of sunlight (independent variable) and the growth rate of sunflowers (dependent variable), with no additional variables considered.
4. What are the 3 major types of hypothesis?
The three major types of hypotheses are:
- Null Hypothesis (H0): Represents the default assumption, stating that there is no significant effect or relationship in the data.
- Alternative Hypothesis (Ha): Contradicts the null hypothesis and proposes a specific effect or relationship that researchers want to investigate.
- Nondirectional Hypothesis: An alternative hypothesis that doesn't specify the direction of the effect, leaving it open for both positive and negative possibilities.
Find our PL-300 Microsoft Power BI Certification Training Online Classroom training classes in top cities:
| Name | Date | Place | |
|---|---|---|---|
| 7 Sep -22 Sep 2024, Weekend batch | Your City | ||
| 21 Sep -6 Oct 2024, Weekend batch | Your City | ||
| 12 Oct -27 Oct 2024, Weekend batch | Your City |
About the Author
Avijeet is a Senior Research Analyst at Simplilearn. Passionate about Data Analytics, Machine Learning, and Deep Learning, Avijeet is also interested in politics, cricket, and football.
Recommended Resources
Free eBook: Top Programming Languages For A Data Scientist
Normality Test in Minitab: Minitab with Statistics
Machine Learning Career Guide: A Playbook to Becoming a Machine Learning Engineer
- PMP, PMI, PMBOK, CAPM, PgMP, PfMP, ACP, PBA, RMP, SP, and OPM3 are registered marks of the Project Management Institute, Inc.
COMMENTS
If the biologist set her significance level \(\alpha\) at 0.05 and used the critical value approach to conduct her hypothesis test, she would reject the null hypothesis if her test statistic t* were less than -1.6939 (determined using statistical software or a t-table):s-3-3. Since the biologist's test statistic, t* = -4.60, is less than -1.6939, the biologist rejects the null hypothesis.
View Solution to Question 1. Question 2. A professor wants to know if her introductory statistics class has a good grasp of basic math. Six students are chosen at random from the class and given a math proficiency test. The professor wants the class to be able to score above 70 on the test. The six students get the following scores:62, 92, 75 ...
Registered nurses earned an average annual salary of $69,110. For that same year, a survey was conducted of 41 California registered nurses to determine if the annual salary is higher than $69,110 for California nurses. The sample average was $71,121 with a sample standard deviation of $7,489. Conduct a hypothesis test.
Table of contents. Step 1: State your null and alternate hypothesis. Step 2: Collect data. Step 3: Perform a statistical test. Step 4: Decide whether to reject or fail to reject your null hypothesis. Step 5: Present your findings. Other interesting articles. Frequently asked questions about hypothesis testing.
They believe that 50% of first-time borrowers take out smaller loans than other borrowers. They perform a hypothesis test to determine if the percentage is the same or different from 50%. They sample 100 first-time borrowers and find 53 of these loans are smaller that the other borrowers. For the hypothesis test, they choose a 5% level of ...
χ2 calculation example | χ2 test in hypothesis testing Step 2: use χ2 table for α = 5% and get χ2 value from the table. from table we got χ2 (critical value at α = 5%) = 3.841 Step 3: compare both χ2 values. The chi-square value of 18.99 is much larger than the critical value of 3.84, so the null hypothesis can be rejected.
The treatment group's mean is 58.70, compared to the control group's mean of 48.12. The mean difference is 10.67 points. Use the test's p-value and significance level to determine whether this difference is likely a product of random fluctuation in the sample or a genuine population effect.. Because the p-value (0.000) is less than the standard significance level of 0.05, the results are ...
Alternative hypothesis: Fewer than 0.50, or 50%, of the population would answer yes to this question. The majority do not think Clinton has the honesty and integrity to be president. Step 2. Collect and summarize data into a test statistic. Sample proportion is: 233/518 = 0.45. The standard deviation = (0.50) × (1 - 0.50) = 0.022. 518
Answer. Exercise 9.5.11 9.5. 11. A teacher believes that 85% of students in the class will want to go on a field trip to the local zoo. She performs a hypothesis test to determine if the percentage is the same or different from 85%. The teacher samples 50 students and 39 reply that they would want to go to the zoo.
Likelihood ratio. In the likelihood ratio test, we reject the null hypothesis if the ratio is above a certain value i.e, reject the null hypothesis if L(X) > 𝜉, else accept it. 𝜉 is called the critical ratio.. So this is how we can draw a decision boundary: we separate the observations for which the likelihood ratio is greater than the critical ratio from the observations for which it ...
In a hypothesis test, sample data is evaluated in order to arrive at a decision about some type of claim. If certain conditions about the sample are satisfied, then the claim can be evaluated for a population. In a hypothesis test, we: Evaluate the null hypothesis, typically denoted with H0.
The test statistic is a one-number summary of all the information in the sample regarding the correctness of the alternative hypothesis. Different kinds of hypothesis tests (e.g., about means, proportions, differences of means, differences of proportions, etc.) require different test statistics. Soon we shall list many standard cases.
A hypothesis is a research question that has to be proved correct or incorrect through hypothesis testing - a scientific approach to test. Call +44 141 628 7786 Sign In ; ... The 3 types of hypothesis tests are: One-Sample Test: Compare sample data to a known population value. Two-Sample Test: Compare means between two sample groups.
A sample of 100 private sector workers reveals an average output of 74.3 parts per hour with a sample standard deviation of 16 parts per hour. A sample of 100 state ... This question is asking for a hypothesis test of the equality of two means in the setting of two independent groups (state v private) .
S.3 Hypothesis Testing. In reviewing hypothesis tests, we start first with the general idea. Then, we keep returning to the basic procedures of hypothesis testing, each time adding a little more detail. The general idea of hypothesis testing involves: Making an initial assumption. Collecting evidence (data).
A hypothesis test consists of five steps: 1. State the hypotheses. State the null and alternative hypotheses. These two hypotheses need to be mutually exclusive, so if one is true then the other must be false. 2. Determine a significance level to use for the hypothesis. Decide on a significance level.
Steps for performing Hypothesis Test of a Single Population Mean. Step 1: State your hypotheses about the population mean. Step 2: Summarize the data. State a significance level. State and check conditions required for the procedure. Find or identify the sample size, n, the sample mean, ˉx. x ¯.
HA (Alternative Hypothesis): μ ≠ 10 inches. This is an example of a two-tailed hypothesis test because the alternative hypothesis contains the not equal "≠" sign. The botanist believes that the new fertilizer will influence plant growth, but doesn't specify whether it will cause average growth to increase or decrease.
Test Statistic: z = x¯¯¯ −μo σ/ n−−√ z = x ¯ − μ o σ / n since it is calculated as part of the testing of the hypothesis. Definition 7.1.4 7.1. 4. p - value: probability that the test statistic will take on more extreme values than the observed test statistic, given that the null hypothesis is true. It is the probability ...
5. Phrase your hypothesis in three ways. To identify the variables, you can write a simple prediction in if…then form. The first part of the sentence states the independent variable and the second part states the dependent variable. If a first-year student starts attending more lectures, then their exam scores will improve.
An analyst performs hypothesis testing on a statistical sample to present evidence of the plausibility of the null hypothesis. Measurements and analyses are conducted on a random sample of the population to test a theory. ... If you have any questions regarding this 'Hypothesis Testing In Statistics' tutorial, do share them in the comment ...
Example 8.4.7. Joon believes that 50% of first-time brides in the United States are younger than their grooms. She performs a hypothesis test to determine if the percentage is the same or different from 50%. Joon samples 100 first-time brides and 53 reply that they are younger than their grooms.
Khan Academy